Here is another wonderfully informative graphic from Visual Capitalist which tracks the ability (or lack thereof) of each generation to earn more than their parents.
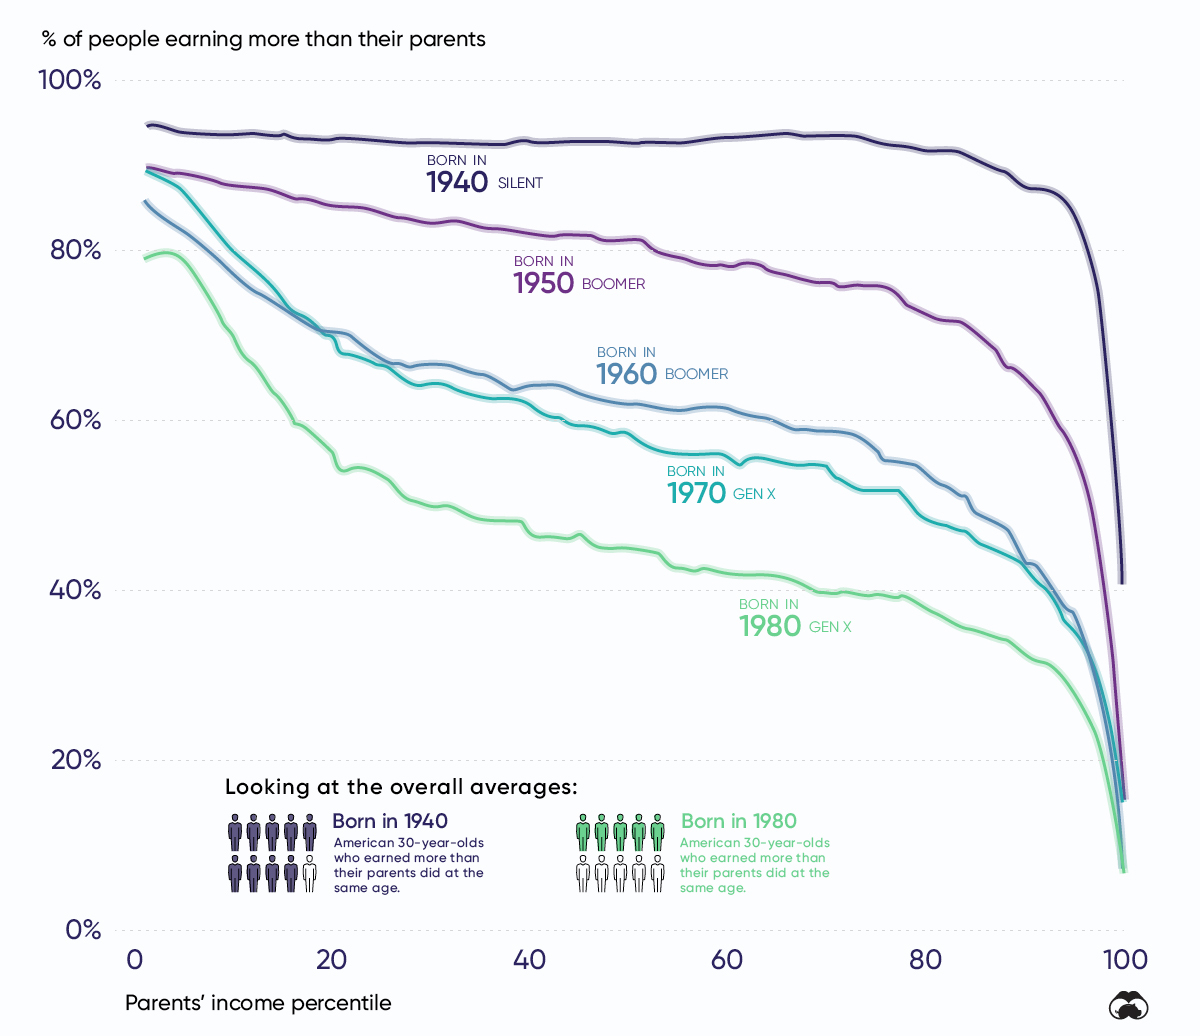
“This graphic plots the probability that a 30-year-old American has to outearn their parents (vertical axis) depending on their parent’s income percentile (horizontal axis). The 1st percentile represents America’s lowest earners, while the 99th percentile the richest.
As we move from left to right on the chart, the portion of people who outearn their parents takes a steep decline. This suggests that people born into upper class families are less likely to outearn their parents, regardless of generation.
The key takeaway, though, is that the starting point of this downward trend has shifted to the left. In other words, fewer people in the lower- and middle-classes are climbing the economic ladder.”
In tabular format, the numbers look like this:
| Decade Born | Chance of Outearning Parents (Bottom Percentile) | Chance of Outearning Parents (50th Percentile) | Chance of Outearning Parents (Top Income Percentile) |
|---|---|---|---|
| 1940 | 95% | 93% | 41% |
| 1950 | 90% | 81% | 15% |
| 1960 | 86% | 62% | 7% |
| 1970 | 90% | 59% | 16% |
| 1980 | 79% | 45% | 8% |
The analysis suggests that stagnant income growth is the main culprit: “The average hourly wage in 1964, when converted to 2018 dollars, is $20.27. Compare this to $22.65, the average wage in 2018.”
Corporate income in the same period has mushroomed beyond all measure, with CEOs and rich investors — who do not rely on income from labour — making money hand over fist. This helps explain why inequality is growing, with the rich growing richer while the poor face ever-increasing financial obstacles.
